|
|
| First biofix (A)
|
Start accumulating degree-days when you first begin trapping adults
consistently. (A series of two or more successive counts at 2 to
3-day intervals; biofix is the first date in the series.)
|
| Monitor damage |
Begin monitoring the orchard for shoot strikes when the degree-day
total approaches 400.
|
| Monitor next flight |
Begin checking pheromone traps twice weekly when the degree-day
accumulation reaches 900. Each generation takes about 950-1080 degree-days.
|
| Second biofix (B)
|
Start accumulating degree-days when there is a consistent increase
in the number of moths trapped.
|
| Treatment
|
If monitoring following the first biofix indicated that damaging
levels were present (3-4 shoot strikes per tree or more), treat
400-500 degree-days after the second biofix.
|
Third biofix (C) and
Fourth biofix (D) |
Start accumulating degree-days when there is a consistent increase
in the number of moths trapped.
|
| Treatment |
If monitoring indicates treatment is necessary, treat 400 degree-days
after the biofix to prevent fruit damage.
|
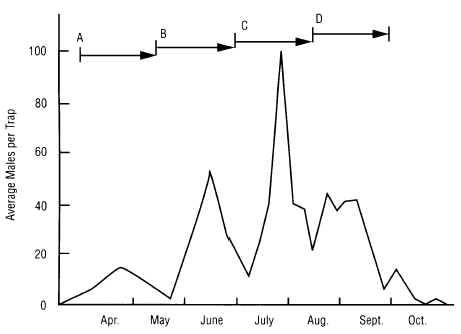
Keep track of peach twig borer flights in your orchard with a graph
like this, which is a plot of trap catch data from an unsprayed peach
orchard in the southern San Joaquin Valley. For each date that traps are
checked, plot the average number of moths per trap. Use the graph to establish
the biofix (A, B, C, D) for each generation of adults. As outlined below,
use degree-day accumulations to schedule monitoring and treatments, if
dormant or bloomtime treatments have not kept the pest from reaching damaging
levels.
Adapted from: Larry Strand.
1999. Integrated Pest Management for Stone Fruits. Oakland: Univ.
Calif. Div. Agric. Nat. Res. Publ. 3389.
|